
This holistic factual snapshot of the global energy system offers timely, comprehensive and objective data. Since 1952.
Your email is needed to access the full report
Verify your email
Download the report
Return Visit — No Re-Verify Needed

In this, the 75th edition of the Statistical Review of World Energy, energy remains at the forefront of the world's political and economic agenda, shaped by changing priorities on energy security, affordability and sustainability. To satisfy the continued insatiable growth in energy demand, we again see growth in all sources of total energy supply. This rigorous dataset is the cornerstone of understanding how these shifting priorities are shaping our global energy landscape.Andy Brown OBE FEI, President - Energy Institute
This year's Review shows an energy system at a tipping point: record demand, a historic breakthrough in low carbon electricity, and sharply diverging regional pathways. We see encouraging substitution of fossil fuels in power, yet global emissions continue to rise and energy security pressures intensify. These findings underline the urgency of accelerating efficiency, electrification and investment in clean technologies worldwide.Dr Nick Wayth FEI, Chief Executive - Energy Institute
The geopolitical fault lines of global energy markets are once again exposed. Even before the second major fossil shock in four years, the data show that global energy supply growth is increasingly renewable and electric, driven by the hard economics of efficiency and security more than by mandate. Trusted, impartial data has never been more critical, and this Review will help equip decision-makers worldwide with exactly that.Aditya Lolla, Interim Managing Director - Ember
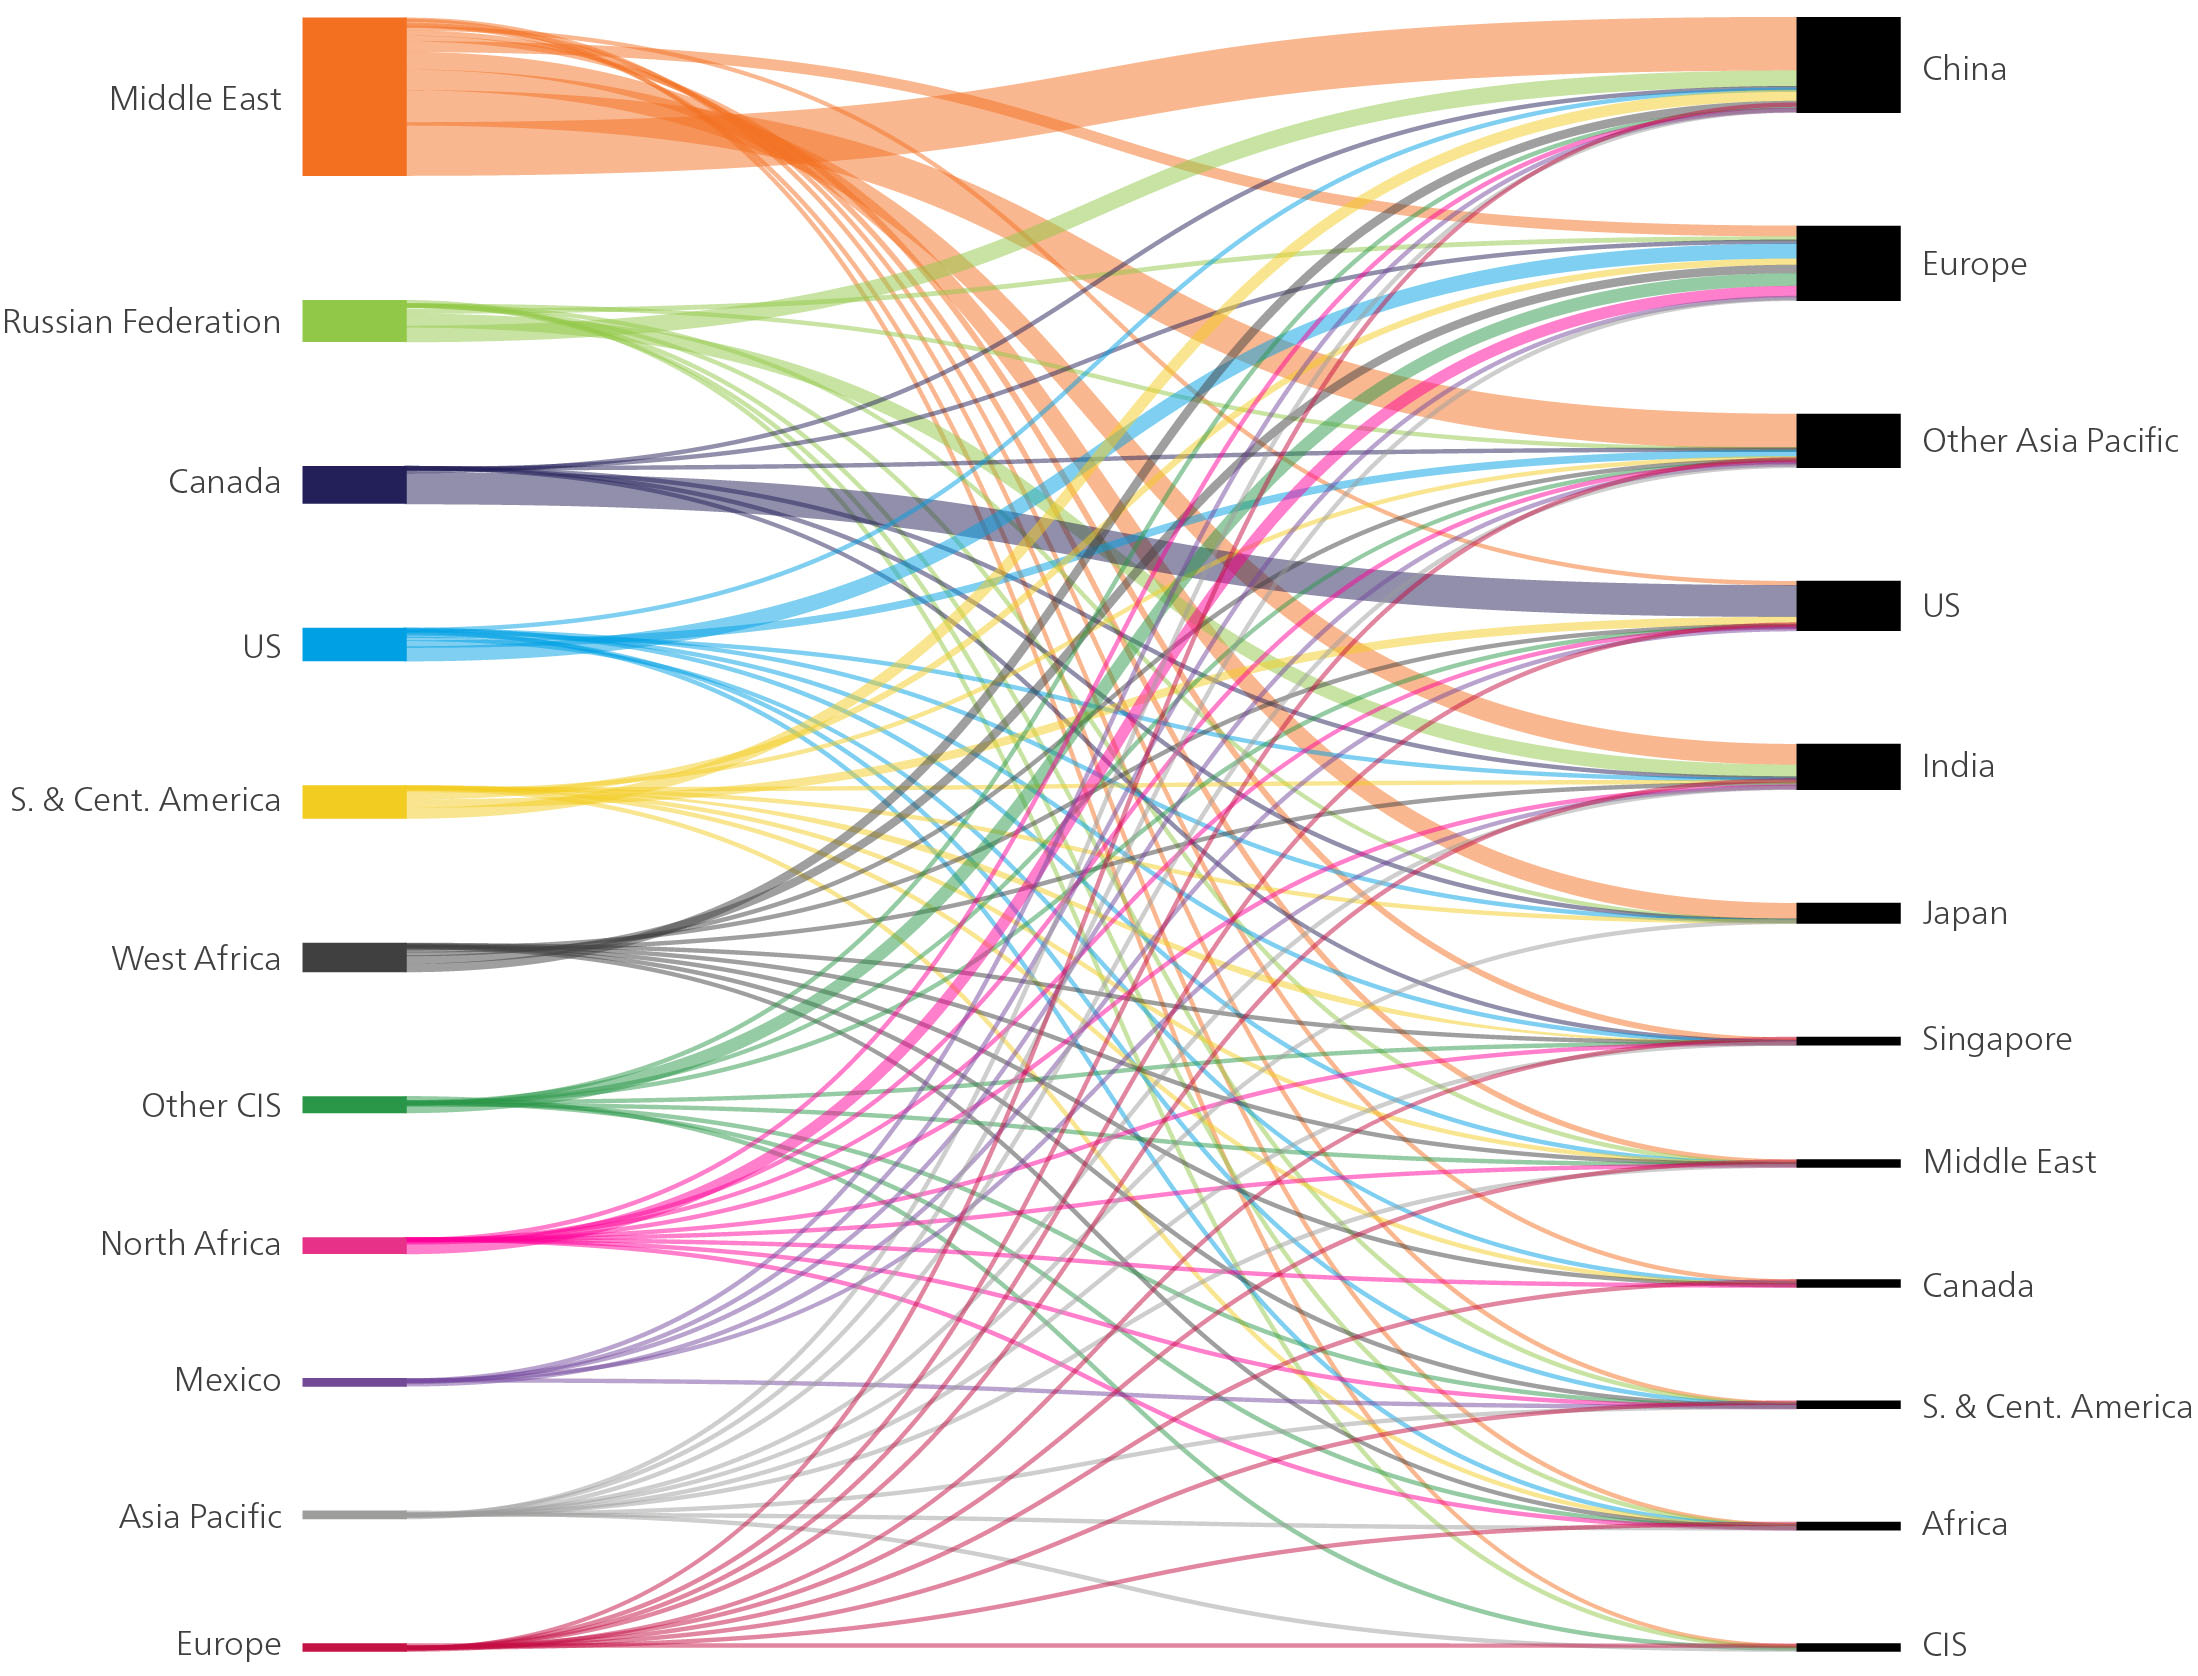
The centre of gravity of global oil supply has structurally shifted. The Americas now produce 20% more oil than the Middle East, a shift that would have been unthinkable at the start of the century; trade flows are being redrawn in real time, and the geography and geopolitics of energy supply is changing rapidly with businesses left to adapt their global strategies into regional responses. The global energy system is no longer moving in one direction, with regions reacting to the same crisis with different responses for building resilience. That divergence is now the defining feature of the global energy market.Wafa Jafri, Partner and UK Lead for Energy and Natural Resources Strategy - KPMG in the UK
The latest Statistical Review confirms that renewable energy is no longer a niche contributor to the global energy mix. Solar and renewables are scaling at unprecedented rates, but deployment alone is not enough. The next phase of the transition will be defined by system-wide execution, ensuring grids, storage, and flexibility solutions keep pace so clean energy growth translates into economic and societal transformation.Maria de Kleijn,
It’s free. The Energy Institute bears the costs of producing the Statistical Review to offer it to everyone, everywhere, as a global public good.
It’s global. More than 50 individual countries and 12 regions are profiled. It’s holistic, covering all of the energy system. Production, consumption, prices, refining, trade movements for a dozen commodities, including coal, oil and oil products, natural gas (including LNG imports and exports), hydroelectric, nuclear, solar PV, wind, biofuels, geothermal, key minerals, hydrogen production, CCUS, as well as total energy supply and CO2 emissions. All the industry; all in one place. Tables display data from 2015-2025. Downloadable Excel data tables go back further, to 1965.
It’s credible. The Statistical Review has a long heritage dating back into the 1950s, but has been recently modernised. A standard data workflow developed and refined over the past 20 years, based around modern database architecture. Thousands of data points are drawn from more than 25 sources of information, including governments and third parties, processed in bespoke software, with data traceability. Validation carried out by a team of industry analysts and Energy Institute staff. Key processes peer-reviewed.
It’s unbiased. The Energy Institute is an independently-funded not-for-profit organisation. It does not favour or promote any particular company or type of energy. Its corporate purpose is to create a better energy future for members and society by accelerating a just, secure and low-carbon energy transition.
Record energy demand: Total energy supply (TES) rose 1.7%, with all major energy sources rising to all-time highs for the second consecutive year.
Low-carbon breakthrough: Renewables were the largest source of TES growth for the first time outside of a recession, with solar power accounting for 71% of the increase in renewables.
US emissions rise faster than China: They grew 3.2%, driven by a 13% surge in coal-fired power - in absolute terms, four times the growth of China.
Solar and storage surge: Solar generation expanded by 30% worldwide, while battery capacity grew at 66%, reinforcing their role as the fastest scaling clean technologies.
Energy security pressures intensify: A 4.8% growth in oil production in the Americas, which has helped lessen the impacts of the current Middle East conflict.
To celebrate its 75th anniversary, the 2026 Statistical Review of World Energy is bigger and better than ever before. In collaboration with our partner Ember and in collaboration with KPMG and Kearney, we offer 10 extra pages of summary and analysis that put energy figures into context. Articles on energy security and import dependence; lessons from the 1970s oil crises; electrification; and a new section of short profiles of key markets: the EU, USA, China, India.