- Published: July 2008
- REF/ISBN: 9780852935064
- Edition: 1st
Executive summary
This report describes work undertaken by the National Physical Laboratory, for the Energy Institute’s Air Emissions Group, to monitor boundary-fence concentrations of particulate phase benzo-[a]-pyrene (B[a]P) at two oil refineries in the UK. Monitoring took place at Refinery A in early November 2004, and at Refinery B in late November/ early December 2004.
NPL acquired five pairs of samples at each refinery; each sample pair consisting of samples taken at nominally upwind and downwind locations of the potential PAH sources at each refinery. Additionally, three pairs of vapour phase samples were acquired at each refinery.
Analysis of these samples revealed that there was no significant difference between the (particulate or vapour phase) B[a]P concentrations at the upwind and downwind sampling locations. In addition, the B[a]P concentrations measured at the refineries were comparable to the concentrations expected at urban sampling locations around the UK PAH Network during November and December.
The average measured concentrations at the refineries were well below the target value stated for PAHs in the European Commission’s Fourth Air Quality Daughter Directive.
1. Background
Following a meeting between the Energy Institute (EI), the National Physical Laboratory (NPL) and the Environment Agency (EA) on 18th March 2004, NPL produced a proposal to monitor boundary-fence, particulate phase benzo-[a]-pyrene (B[a]P) emissions at two oil refineries in the UK.
The purpose of the project was to establish whether or not there is currently a problem with the concentration levels of benzo-[a]-pyrene being emitted from oil refineries. It was agreed that in order to establish the likelihood of benzo-[a]-pyrene being a significant problem the project should look at the near worst-case meteorological and environmental conditions (little wind, little sun, low ozone, normal refinery operating conditions). It was decided that the most likely times for these conditions to be met would be November and December. If B[a]P emissions from refineries are not significant this needed to be established under near worst-case conditions so that we can have confidence in the transferability of the conclusions to other ambient conditions.
It was proposed that simultaneous upwind and downwind samples would be taken at each location. If B[a]P emissions from the refineries were a significant contributory factor to the total B[a]P concentration in ambient air at the boundary fence, this should be clear from the discrepancy between the B[a]P concentrations recorded upwind and downwind of the refineries. This procedure was practiced to operate, in contrast to other methods, which would require measurements of the maximum concentrations where plume grounding occurred.
It was agreed that measured data of B[a]P from individual stacks was not possible. Sufficient information should be gained from measuring at the boundary-fence and modelling these data, if required. The modelling process would require input on meteorological conditions (available from local Met. Offices), an idea of known likely sources (e.g. oil fired furnaces, cat crackers), as well as information on emissions from the refinery during the survey, information on stack heights, diameter, emissions temperature and velocity. NPL would collate this data for input into any modelling exercise that might be subsequently conducted by the EA. This would determine post-hoc whether the boundary fence is a suitable monitoring location to capture B[a]P emissions produced from within the refinery.
2. Methodology
NPL visited the two oil refineries during November and December 2004 to conduct two separate monitoring exercises.
A minimum of three separate pairs of, simultaneously acquired, upwind and downwind samples were concurrently taken at each site. Samples were acquired using two Graseby Andersen High-Volume samplers (with a sampling rate 68 m3 h-1) with a PM10 size selective inlet, sampling in parallel. The particulate phase of the ambient air was collected on quartz filters within the samplers. For a selection of the samples, polyurethane foam inserts were used, in addition to the particulate filters, in order to sample B[a]P in the vapour phase. The particulate and vapour phase samples were analysed separately. The flow rate of the High-Volume Samplers was calibrated, traceable to national flow standards, before each sample was taken.
In addition, at each site, a field blank filter, and field blank polyurethane foam insert, was analysed to determine the blank levels to be subtracted from the measured results.
Initially sampling periods of 48 hours were envisaged. However, owing to the limited number of sampling sites available at each refinery coupled with the variability of the wind direction over relatively short periods, it was clear that a more robust study would be obtained with a greater number of shorter sampling periods.
During sample acquisition the samplers were placed in the locations which would be the closest to being directly upwind and downwind from the predicted centre of B[a]P emission. This siting was based on local Met Office weather forecasts for the forthcoming sampling periods. At Refinery B there were no options for sampler location, so in this instance the methodology was to wait until the wind was set to be in a beneficial direction for the duration of the sampling period. Once the samples started being collected, the samplers were then not moved during the sampling period.
During the sampling period real time local metrological data, such as wind direction, wind speed, temperature and pressure was gathered. Additionally, hourly meteorological observations of rainfall, visibility and cloud cover were also taken during the day and supplementary air pollution information was obtained for the sampling periods. These observations ensured that the samples were gathered under worst-case meteorological conditions; for example, there was no more than 30 minutes of rainfall during any sampling period, and during all sampling periods ozone concentrations (which can degrade sampled B[a]P) were low.
Emissions information, for the main sources of B[a]P on the refinery, such as source height, emission flux and emission temperature, was provided by the refinery.
After sampling the filters and polyurethane foam inserts were uniquely labelled and stored securely by NPL.
The extraction and analysis of the filters was performed using NPL’s fully validated methodology for PAH measurement in ambient air. The process is completely described by a full measurement equation and robust uncertainty budget, covering all aspects of sampling, extraction and analysis, in order to deliver concentrations values of PAHs in ambient air with valid uncertainty statements. This methodology has been developed to be fully compliant with ISO 12884 and the proposed analysis strategies currently being drafted by CEN/TC264/WG21.
Validation of the extraction procedure is carried out regularly by the extraction and analysis of a US National Institute of Standards and Technology (NIST) standard reference material (usually NIST SRM 1649a). This procedure is carried out regularly to ensure the accuracy and consistency of the results. In addition, before each extraction a surrogate standard, in this case per-deuterated perylene, is added to each sample in order to evaluate the efficiency of the extraction process and the variability in this extraction. Our procedures have been designed to ensure that this extraction efficiency is maximised and the uncertainty in this is maintained within acceptable limits.
NPL analysed the B[a]P extracts using GC-MS. The sample analysis is performed by a Hewlett-Packard 6890 GC system with 5973 Mass Selective Detector (MSD) and HP-5MS crosslinked PH-ME siloxane column (60m x 0.25mm x 0.25mm film thickness). The GC-MS is maintained according to the manufacturer’s instructions with air and water checks and a mass calibration being carried out before each analysis sequence.
Calibration is carried out using at least three gravimetrically prepared concentrations of NIST standard reference solutions containing all PAHs of interest and the internal standards to be used (d12-B[a]P and d 10-phenanthracene). The concentrations of the calibration solution are always chosen so as to bracket the likely value of the sample to be measured in order to ensure the best possible accuracy during calibration.
The corrected peak area ratios are analysed by a method of generalised least squares (GLS) using XGenline (an NPL-developed program), to construct a calibration curve and determine the mass fractions and uncertainties of the unknown samples.
The vapour phase samples on the polyurethane foam inserts were analysed by Marchwood Scientific Services (Marchwood, Southampton) who have UKAS accreditation for this procedure.
Results are quoted as the mass of B[a]P per cubic metre of ambient air with measurement uncertainties where applicable.
3. Results
Details for the samples taken during the two site visits, including measured B[a]P concentrations, are given in Tables 1 and 2. Measurement uncertainties are quoted at the 95% confidence level.
The wind distribution data in Tables 1 and 2 has been calculated from wind-roses for the relevant sampling periods provided by the refineries.
'Downwind' is the more important classification for this study, and therefore wind origins that represent directions downwind of individual sampling locations are highlighted in Tables 1 and 2.
If a refinery is producing significant additional B[a]P emissions, and these are measurable at the boundary-fence, then the measured concentrations of B[a]P would be expected to be significantly higher at the sampling locations classified as downwind of the refinery as compared to sampling locations classified as upwind of the refinery.
In this study, to be classified as a 'downwind' sampling location, the wind direction must have been directly from the source area towards the sampler area for a large majority of the sampling period.
The classification of upwind sampling locations is less rigorous. To be classified as 'upwind', a sampling location one must only ensure that there is no significant component of 'downwind' nature during the sampling period. The upwind sample is expected to represent a measurement of the 'background' or 'ambient' concentration.
Samples where no downwind sampler can be rigorously identified (e.g. because the wind is orthogonal to the axis of source and sampler) are also useful as these act as control samples.
Since it was not intended to compare results between different pairs of samples, the wind roses have not been weighted according to wind speed.
The sample pairs acquired at each refinery were assessed as follows:
- For Refinery A: Sample Pairs 1, 2, 3 and 5 contain valid upwind and downwind measurements. Sample Pair 4 acts as a control measurement.
- For Refinery B: Sample Pairs 1, 2 and 3 contain valid upwind and downwind measurements. Sample Pair 4 and 5 act as control measurements.
Figures 1 and 2 provide a graphical comparison of the measurement results of the sample pairs at each refinery.
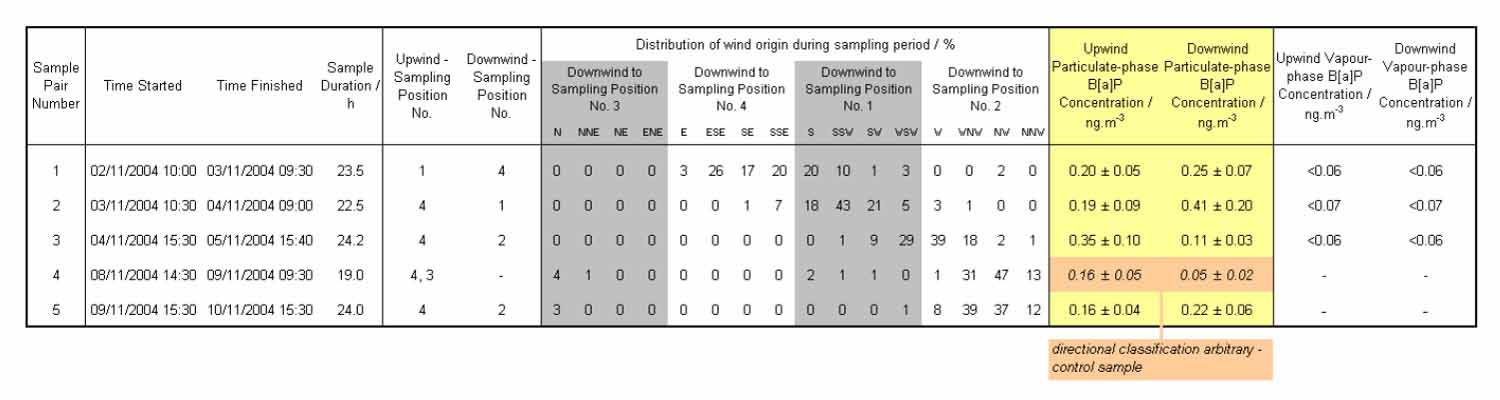
Table 1: Samples taken at Refinery A
The amount of B[a]P measured in the sample blanks was insignificant - corresponding to ambient concentrations of less than 0.005 ng.m-3.
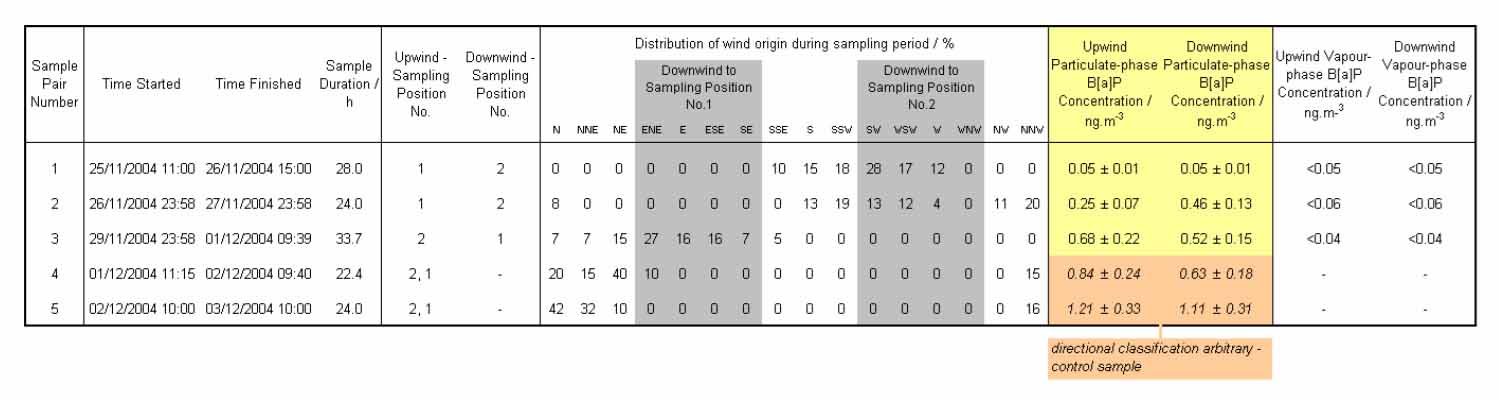
Table 2: Samples taken at Refinery B
The amount of B[a]P measured in the sample blanks was insignificant - corresponding to ambient concentrations of less than 0.005 ng.m-3.
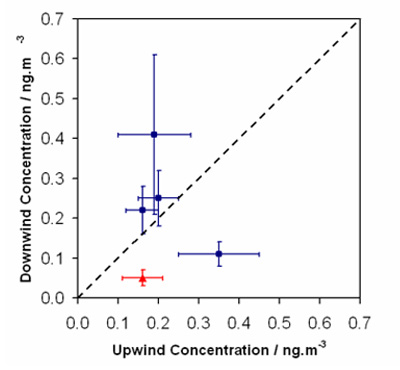
Figure 1: Comparison of the upwind and downwind particulate phase B[a]P concentrations at Refinery A
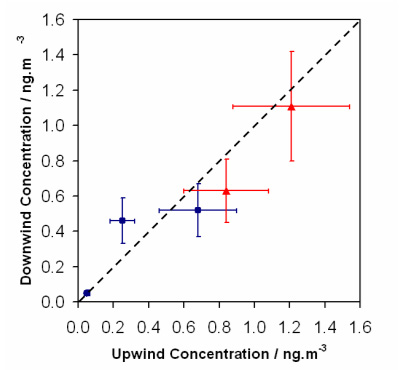
Figure 2: Comparison of the upwind and downwind particulate phase B[a]P concentrations at Refinery B
⬤ valid upwind and downwind measurement pairs
▲ control measurements.
The error bars represent the measurement uncertainty at the 95% confidence level. The dashed line indicates the locus of equal upward and downwind concentrations.
As can be seen from the graphs, the majority of measurement pairs (both upwind-downwind sample pairs and control samples) show no significant difference between the measured upwind and downwind concentrations, within the accuracy of the measurements.
The deviations from the line of equal upwind and downwind concentrations, appears to be random in nature, and is most probably due to variable contributions from more local emission sources, whose effect cannot be rigorous gauged.
4. Conclusions
Analysis of the B[a]P concentration levels measured reveal that there is no significant difference between the (particulate or vapour phase) B[a]P concentrations measured at the upwind and downwind boundary-fence sampling locations, within the accuracy of the measurement methodology.
As expected, owing to its low volatility, the concentrations of B[a]P measured in the vapour phase was significantly lower than in the particulate phase.
Furthermore, the concentrations of particulate phase B[a]P in all the samples taken were relatively low. The B[a]P concentrations measured at the refineries are comparable to the concentrations expected at urban sampling locations around the UK PAH Network during the fourth quarter of the year. To illustrate this, the table below compares the average B[a]P concentrations recorded at the refineries with the average fourth quarter concentrations recorded at a selection of sites on the UK PAH monitoring Network.
Additionally, the average measured concentrations at the refineries were well below the target value stated for PAHs, of 1.0ng.m -3, in the European Commission’s Fourth Air Quality Daughter Directive.
Table 3: Average B[a]P concentrations recorded at the refineries during the sampling periods
(November and December 2004) together with the average fourth quarter concentrations recorded at a selection of sites on the UK PAH monitoring Network during October to December 2003
| Location | Average B[a]P concentration [ng.m-3] | Comments |
|---|---|---|
| Lisburn | 1.80 | urban site (substantial solid fuel use) |
| Refinery B Leeds Manchester London Refinery A Glasgow Hazelrigg |
0.58 0.42 0.37 0.25 0.21 0.18 0.05 |
urban site urban site urban site urban site urban site |
5. References
— Directive 2004/107/EC of the European Parliament and of the Council (of 15 December 2004) relating to arsenic, cadmium, mercury, nickel and polycyclic aromatic hydrocarbons in ambient air, Official Journal of the European Union, L 23 26.1.2005, p.3
— EN 12341:1998, Air quality – Determination of the PM10 fraction of suspended particulate matter – Reference method and field test procedure to demonstrate reference equivalence of measurement methods
— ISO 12884:2000, Ambient air – Determination of total (gas and particle-phase) polycyclic aromatic hydrocarbons – Collection on sorbent-backed filters with gas chromatographic/mass spectrometric analyses
— prEN Working Document, CEN TC264 WG21, Air quality – Reference method for the measurement of benzo[a]pyrene (B[a]P) in ambient air
Acknowledgements
This Report was produced for the Environment Agency for England and Wales and the Energy Institute by the National Physical Laboratory. The EI wishes to thank NPL and the principal authors Richard J. C. Brown, Peter T. Woods, Andrew S. Brown and Roger S. Brown.
The project was steered by a joint EI and EA Steering Group, members of which included:
| Martin Chapman Dave Dando Martin Maeso Chris McDonald Brian Smithers Alison Walker Mike Williamson John Wormald Graham Nea Jenny Lyn |
BP formerly ExxonMobil EI EA Consultant ConocoPhillips EA Total ExxonMobil EI |
Our publications website is designed exclusively for EI members and customers to easily access and download PDF versions of our publications. For hard copies, please contact the EI Publishing Team at [email protected]. To access previously downloaded copies go to My publications.
-
 User Type
-
PDF Document
-
 Hard copy
-
 25% discount on most EI publications
-
 Free access to other EI publications
- Technical partners
- Free
- Contact us
- Technical company members
- Free
- Contact us
- Limited access
- EI member
- Free
- Contact us
- Non-member
- Free
- Contact us
Your membership
Technical partners
-
PDF Document
Free
-
Hard copy
Contact us
-
Free access to other EI publications
Your membership
Technical company members
-
PDF Document
Free
-
Hard copy
Contact us
-
Limited access to other EI publications
Your membership
EI member
-
PDF Document
Free
-
Hard copy
Contact us
-
Limited access to other EI publications
Your membership
Non-member
-
PDF Document
Free
-
Hard copy
Contact us
-
Limited access to other EI publications